

CURRENT IT TREND IN DATA VISUALIZATION
Data: the single most important asset that can make or break any business. It is the crowning jewel of any enterprise and holds the key to unlock a continuously evolving growth model that can only improve with time. However, data alone is just half of the equation. The other half is the way it is perceived and analyzed.
Image: https://pixabay.com/photos/transformation-digital-woman-face-3750134/
The Problem With Data
Data all by itself cannot guarantee the right decision-making in view of the way the human mind functions. We are visual creatures; in fact, nearly 90% of all information transmitted to the human brain is visual in nature. We process visual information much faster than we understand other forms of data as multiple studies have established time and again. The writing on the wall is clear: the way data is presented is equally important as the data itself, if not more.
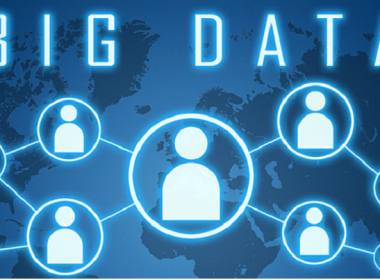
The problem with data is intensified when we consider the diverse sources from which modern enterprises and businesses extract data. From social media to abandoned e-commerce carts, big data is characterized by its volume and variety: the fact that it is so varied in its nature and form makes it all the more complex to handle considering the tightening demands on big data velocity . Businesses want to analyze data faster than ever before. That can only be done, however, when data is understood right in the first place.
Enter Data Visualization: It’s Not Just About The Interface
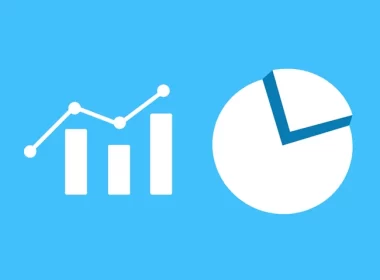
Perhaps never before has the importance of data visualization been so intensely realized than in the 21st century. Businesses have realized that the real value of data can only be realized once it is presented the right way. Data visualization does just that: it focuses on the right way to present the aggregated information so as to facilitate analysis and decision-making.
However, this is not where data visualization ends. It’s really an ocean with depths so profound; we’ve only scratched the surface. Experts repeatedly warn against excessive consideration for the visualization interface. No doubt, a de-cluttered and aesthetically pleasing system can be a refreshing delight but if it does not provide actionable data at the right time and at the right place, it loses most of its importance.
Image: https://pixabay.com/vectors/chart-graph-graphic-statistics-35773/
Many existing visualization interfaces, for instance, are beautiful enough but will not be accessible on a mobile device. Needless to say, a data strategist on the move will not be able to identify and study patterns when desired.
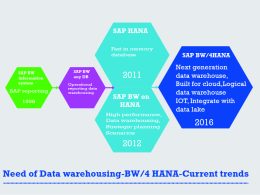
Data Visualization Trends
The following trends are rapidly emerging in the data visualization space and are expected to gain more momentum with the increased flow of finances and interest.
Data cleansing: Not all data obtained is complete or accurate. There are often missing pieces that must be assembled to complete the puzzle. Enterprises are going creative to develop newer ways to cleanse data and initiatives to incentivize members; such efforts have been gaining some favor.
Storytelling endeavors: Humans have long responded well to stories much better than numerical facts and figures. While storytelling is nothing new in marketing, the technique is now being applied in the field of data visualization to present data to humans in a human-friendly form. Organizations are increasingly realizing the importance of understanding data and presenting it through impactful and personalized stories and experiences to their members.
Image: https://pixabay.com/vectors/menu-window-internet-web-design-145771/
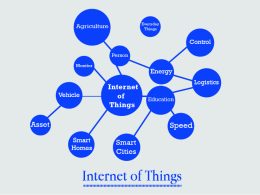
The Rise of Machine Learning and AI: If there’s one technology that has tremendously impacted nearly every industry and ecosystem, it has to be Artificial Intelligence. Data visualization is no different. Machine learning and AI can help discover critical patterns in data which can then be exploited to maximal effect. The key to the power of machine learning models is that they constantly evolve and get better at analyzing data which is a critical asset in data science.
Image: https://pixabay.com/vectors/analytics-business-resources-wordle-1368293/
Color Palettes: Designers are now waking up to the importance of carefully selecting color palettes for their data visualization maps. The use of colors to aid understanding for visually impaired individuals and those with limited color perception will expand the accessibility and reach of analysis.
Conclusion
The future is here and data visualization is inevitably a major facilitator on this journey. As data visualization tools continue to evolve, they will pave the way for a much better understanding of the way the world functions and information is exchanged.
Data visualization experts will only see a tremendous increase in opportunities as enterprises continually expand their comprehension of the wonder that is data and the immense possibilities that it holds.
Current IT Trend in Data Visualization